Why Weekly Reports Still Matter
Weekly reports keep teams aligned and stakeholders informed. The problem is that building them takes too long. You pull data from three different tools, format it in a slide deck, and by the time you send it, people barely skim it.
Claude changes this. Instead of spending Friday afternoon wrestling with formatting, you spend 10 minutes building a complete report and sharing it as a link. The format is better, the turnaround is faster, and you actually look forward to sending it.
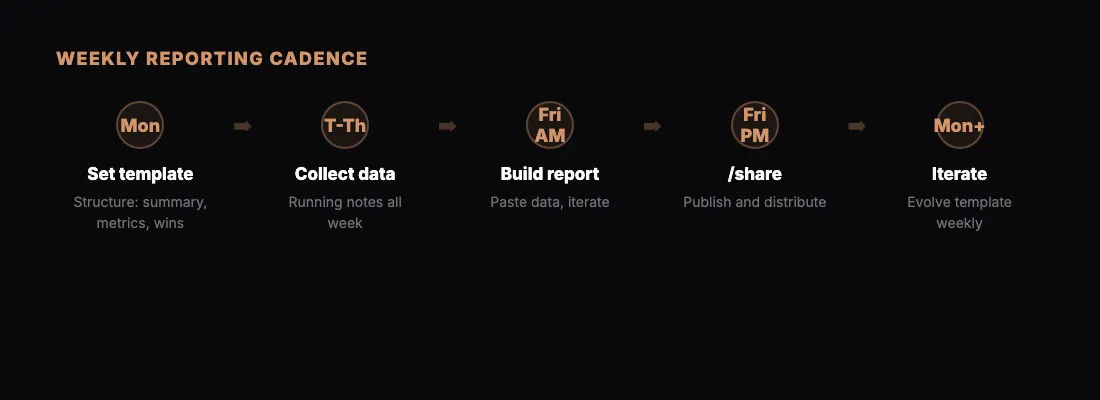
Here is the workflow we use, broken down by day.
Monday: Set the Template
Start the week by establishing what your report will cover. If this is your first week, create the template from scratch. If you have been doing this for a while, refine last week's version.
Open Claude and set the foundation:
"I need a weekly report template for my marketing team. Sections should include: executive summary, key metrics (traffic, leads, conversion rate, ad spend), wins this week, blockers, and next week's priorities. Use a clean professional layout with a sidebar for metrics and a main area for narrative sections."
Save this prompt somewhere you can find it. A text file, a note, even a pinned Slack message. This is your reusable template, and it gets better every week as you refine it.
If you are working with a client reporting workflow, adapt the template to match what the client expects to see. Different stakeholders want different things.
Tuesday Through Thursday: Collect Data
Throughout the week, keep a running document of things that belong in the report. This does not need to be fancy. A bullet list works:
- Blog post published Tuesday, got 2,400 views by Thursday
- Google Ads CPC dropped 12% after we paused the underperforming campaign
- New landing page A/B test started Wednesday
- Design team blocked on the homepage refresh waiting for copy
The key habit here is capturing things as they happen rather than trying to remember everything on Friday. Paste data exports, copy metric screenshots, and jot down notes. Raw is fine. Claude will clean it up.
Friday Morning: Build the Report
This is where Claude earns its keep. Take your collected notes and data, paste them into Claude, and reference your template:
"Here is this week's data and notes. Build the weekly marketing report using the format we established. Executive summary up top, key metrics in the sidebar, narrative sections for wins, blockers, and priorities. Make the metrics compare to last week's numbers: traffic was 45,200 (last week 42,800), leads were 312 (last week 287), conversion rate 2.8% (last week 2.6%), ad spend $4,200 (last week $4,600)."
Claude produces a complete HTML report with styled tables, trend indicators, and clean typography. Review it. Ask for adjustments:
- "Move the blockers section above next week's priorities"
- "Add a small chart showing the traffic trend over the past 4 weeks"
- "Make the executive summary more concise, two sentences max"
Each change takes seconds. You are iterating on a polished document without touching CSS or rearranging slide layouts.
Friday Late Morning: Share and Distribute
Once the report looks right, publish it:
"/share"
Claude publishes the report to sharable.link and gives you a URL. If the report contains sensitive numbers, add password protection to keep it secure.
Send the link to your stakeholders. Slack, email, project management tool, wherever your team communicates. Recipients click and read it in their browser. No downloads. No "can you export this as PDF" requests. No broken formatting.
The Following Monday: Iterate
This is where the workflow compounds. The next Monday, you do not start from scratch. You start from last week's report and improve:
"Here is last week's report URL and this week's updated data. Build the same report structure but update all numbers. Keep the sections that worked, but this week add a section for campaign performance since we launched the new email sequence."
Your template evolves. Sections get added or removed based on what stakeholders actually read. The format tightens up. After a month, you have a reporting workflow that takes 15 minutes and produces better output than what used to take two hours.
Prompts for Each Step
Here are the specific prompts to copy and adapt:
Template creation:
"Create an HTML weekly report template for [your team/function]. Include these sections: [list sections]. Use a professional layout with a metric summary at the top and detailed sections below. Color scheme: [your brand colors or 'clean and neutral']."
Data integration:
"Here is this week's raw data: [paste data]. Update the weekly report with these numbers. Compare to last week where applicable. Highlight anything that changed by more than 10% in either direction."
Iteration:
"This is good but make these changes: [list changes]. Also, the executive summary should focus on [specific talking point this week]."
Sharing:
"/share" or "/share with password [your-password]"
Tips for Making It Stick
Timebox it. Give yourself 20 minutes maximum on Friday. If the report is not done, share what you have. Perfectionism kills weekly habits.
Keep a prompt library. Save your best prompts in a document. After a few weeks, you will have a collection of proven prompts that produce exactly what you need.
Ask for feedback. After the first two weeks, ask your stakeholders what they want more or less of. Adjust the template accordingly.
Automate the data collection. If you find yourself pulling the same exports every week, see if you can generate the report directly from your data with less manual prep.
What This Looks Like at Scale
Teams that adopt this workflow typically see a few patterns emerge:
- Reports become more consistent because the template enforces structure
- The quality goes up because Claude handles formatting while you focus on insight
- Stakeholders actually read the reports because they open instantly in a browser
- The person writing the report stops dreading Fridays
If you manage multiple reports, the same workflow applies to each one. Different templates, different data sources, same process. Monday: template. Week: collect. Friday: build, share, done.
Start This Friday
You do not need permission or a new tool subscription. Open Claude, paste in some data from this week, and ask for a report. When it looks good, type /share. You will have a live, shareable weekly report before lunch.
The first one takes the longest. By week three, it is muscle memory.