The Consulting Deliverable Problem
As a consultant, your value is in your thinking. But a surprising amount of your time goes into packaging that thinking into something presentable. Building the slide deck. Formatting the report. Exporting to PDF. Setting up a file share. Chasing down someone who cannot open the attachment.
These tasks do not generate revenue. They do not improve the quality of your analysis. They are pure friction between your expertise and the client receiving it.
Claude eliminates that friction. You describe what you need, Claude builds a polished deliverable, and sharable.link publishes it as a URL. The client clicks and reads. No downloads. No formatting issues. No "Can you resend that in a different format?" emails.
Here are the four deliverable types where this workflow has the biggest impact for consultants.
Research Reports
Research is the foundation of most consulting engagements. Market analysis, technology assessments, vendor evaluations, regulatory landscape reviews — all of these require synthesizing large amounts of information into a structured, readable document.
The workflow:
- Conduct your research through your normal channels. Interviews, desk research, data analysis, whatever your process is.
- Collect your findings in a raw format. Bullet points, data tables, quotes, and observations.
- Feed everything to Claude with clear instructions:
"Create a market research report as a polished HTML page. Topic: [topic]. Client: [client name].
>
Include: executive summary (key findings in 3 bullets), methodology section, market overview with size and growth data, competitive landscape with a comparison matrix, key trends (5 trends with analysis for each), risk factors, and strategic recommendations.
>
Data and findings: [paste your raw research]
>
Design: professional consulting report style. Use data visualization for the market data. Include a table of contents with anchor links."
- Review, iterate, and refine the output.
- Share via
/sharewith password protection for client-confidential content.
The research report that used to take a full day to format now takes 30 minutes. Your analysis is the same. The packaging is just faster.
For a deeper look at generating reports with AI, see how to use Claude as a report generator.
Strategy Documents
Strategy docs are where consultants earn their fee. These documents lay out a recommended path forward, supported by analysis, and frame the decisions the client needs to make.
The challenge is that strategy documents need to be both rigorous and persuasive. They need to present options, analyze trade-offs, and make a clear recommendation while acknowledging complexity.
The prompt pattern for strategy docs:
"Create a strategic recommendation document as an HTML page. Client: [client name]. Topic: [strategic question].
>
Structure:
- Situation overview: what is happening and why it matters
- Three strategic options with pros, cons, cost implications, and timeline for each
- Recommended option with detailed rationale
- Implementation roadmap with phases and milestones
- Key risks and mitigations
- Decision framework: what the client needs to decide and by when
>
Supporting analysis: [paste your analysis, data, and reasoning]
>
Tone: confident and direct. This should read like a recommendation from a trusted advisor, not a list of possibilities."
Iteration tips for strategy docs:
The first draft will cover the structure, but the tone and emphasis often need adjustment. Focus your iteration on:
- Making the recommendation section more decisive. Clients hire consultants for recommendations, not options.
- Tightening the situation overview. It should create urgency without being alarmist.
- Making the implementation roadmap actionable. Each phase should have clear owners and deliverables.
"Make the recommended option section stronger. Do not hedge. We believe this is the right path and the document should reflect that confidence. Add a section explaining what happens if they delay this decision by 6 months."
Competitive Analysis
Competitive analysis is a staple of consulting work. Clients need to understand where they stand relative to competitors, where the gaps are, and what moves they should make.
The workflow:
- Gather competitive intelligence. Product features, pricing, positioning, market share, recent announcements, customer reviews.
- Organize it by competitor.
- Build the analysis with Claude:
"Create a competitive analysis deliverable as an HTML page. Client: [client name]. Industry: [industry].
>
Competitors to analyze: [list 4-6 competitors]
>
For each competitor, include: company overview, target market, product strengths, product weaknesses, pricing model, recent strategic moves, and threat level (high/medium/low).
>
Also include: a feature comparison matrix across all competitors, a positioning map (2x2 grid with relevant axes), overall competitive gaps and opportunities, and recommended actions.
>
Data: [paste your research for each competitor]
>
Design: use a card layout for individual competitor profiles. Make the comparison matrix a styled table with color coding. The positioning map should be a visual 2x2 grid."
The output gives the client a complete competitive picture they can reference throughout the engagement. Because it is a web page, it is searchable, linkable, and easy to share with their team.
Data Dashboards
Consultants who work with data, whether financial modeling, operational metrics, or performance analytics, need to present numbers in a way that drives decisions.
Static charts in a PDF work, but interactive HTML dashboards work better. The client can see summary metrics, dig into the details, and reference the dashboard throughout the engagement instead of just during the presentation meeting.
The prompt pattern for dashboards:
"Create an interactive data dashboard as an HTML page. Client: [client name]. Purpose: [what decisions this dashboard supports].
>
Key metrics to display at the top: [list 4-6 KPIs with values]
>
Charts: [describe each chart — type, data, what it should show]
>
Tables: [describe each data table]
>
Commentary: include a brief analysis section after each major visualization explaining what the data means and what actions it suggests.
>
Data: [paste your data]
>
Design: dashboard layout with a dark header, metric cards at the top, and a clean grid of charts and tables below."
For a step-by-step walkthrough of building and sharing dashboards, check how to share a Claude-built dashboard.
The Solo Consultant Advantage
If you are an independent consultant or a small firm, this workflow gives you a capability that used to require a design team.
Large consulting firms have dedicated teams that turn consultant analysis into polished deliverables. Independents and small firms have always been at a disadvantage here because the same person doing the analysis also has to do the formatting.
Claude closes that gap. Your deliverables look just as polished as those from a large firm, but you produce them in a fraction of the time. The client sees a professional, well-designed document. They do not know or care whether it was formatted by a design team or generated by AI.
What matters is the quality of your thinking and the clarity of your presentation. Claude handles the presentation so you can focus on the thinking.
A Typical Consulting Week
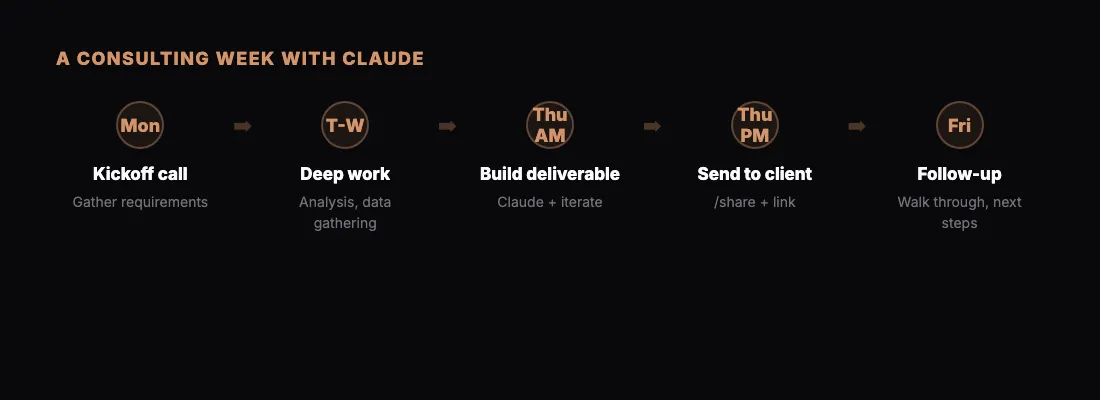
Here is what a week looks like when you adopt this workflow:
Monday: Client kickoff call. Gather requirements and context. Start research.
Tuesday-Wednesday: Deep work. Analysis, interviews, data gathering. Keep notes in a running document.
Thursday morning: Open Claude. Build the deliverable from your notes and analysis. Iterate until polished. Run /share with password protection.
Thursday afternoon: Send the link to the client with a brief summary email. "Here is the analysis we discussed. Password sent separately."
Friday: Follow-up call to walk through the deliverable and discuss next steps.
That cadence is faster than most clients expect. And because the deliverable is a live URL, you can update it after the Friday discussion without resending files.
Hosting Without the Hassle
One underappreciated benefit for consultants is that sharable.link handles hosting. You do not need a personal website, a staging server, or a file-sharing account. The page lives at a clean URL that you can share with anyone.
For consultants who want to showcase their work publicly, like a methodology overview or a thought leadership piece, the pages work as lightweight web content. For confidential client work, password protection keeps everything secure.
Read more about free HTML hosting with sharable.link if you want to explore the hosting angle.
Getting Started
Pick one deliverable from your current client workload. Something you need to produce in the next few days. Instead of opening your slide deck template or Google Doc, open Claude.
Describe what you need. Include your data and analysis. Let Claude build the deliverable. Iterate until it meets your standards. Share it.
The first deliverable might take 45 minutes as you get comfortable with the prompting. The second will take 20. By the third, you will have a workflow that is genuinely faster and produces better-looking output than your previous process.
The time you save goes straight back into billable work or, better yet, into thinking more deeply about the client's problem.